|
|
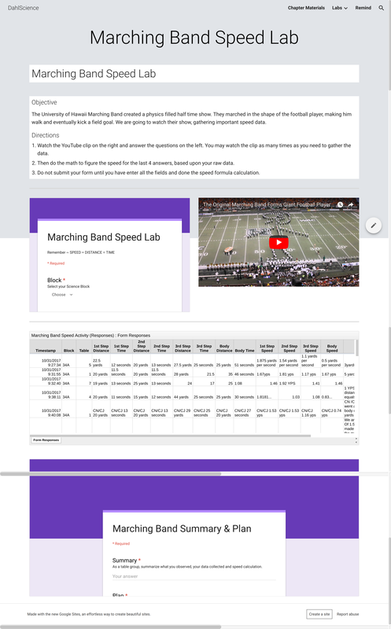 We are in the process of learning how to work together and to do collaborative labs in our 6th grade middle school experience. Our subject is physical science and we are in our motion chapter. The emphasis is calculating speed and average speed. There of course the basic “Distance over Time equals Speed” to calculate average speed.
Using the new Google sites, forms, spreadsheet and YouTube, we are able to achieve all of that in an interactive lab website. I used a YouTube video clip from the University of Hawaii marching band to calculate how fast the members were moving across the field for their halftime show. There are many videos of this type to use in an interactive website. I chose this one due to it ease of observing how the band members moved across the yard lines creating their half time entertainment. In the video I selected, the band created a stick figure football player, that would march down the field and finally kicking a football field goal, with the cheer team holding this large pigskin. Though the video is seven or eight years old, it is still a work of science beauty. The stick figure football player they created took two full steps and a third to kick the football. Our assignment was to calculate their average yards per second for each of the step as well as measuring the average speed for the center of the body. The initial class reaction to the video was amazement. Then it was time to get to work and start counting the yard lines that they that the band crossed. Next was to bring the element of time into each step to calculate the average speed. Students watched and re-watch the video to try to get it just right. When finished collected and calculating their data it time to enter in a user-friendly Google form. The form and video were laid out side-by-side on the lab website. A simple submit moved the lab table data to the spreadsheet, just below the video and the Google data entry form. Analyzing the lab data easy, whether in a large or small group. The students could compare their data with that of the other lab tables in this class, as well as all my other classes that did the same lab. If there was an error in data entry or calculation, the lab table could easily re-enter as needed and learning from those other data points that were entered. All of this happening in real-time in each class. In summary I felt this lab was a success. It promoted lab table collaboration, as well as table to table and even class to class. The new Google sites was so easy to create this lab, inserting the form, the results spreadsheet, and YouTube video. In addition, students not in class that day could do the lab from home or from a remote location as needed, still having the ability to collaborate digitally. Comments are closed.
|
Archives
January 2023
Categories |
 RSS Feed
