|
|
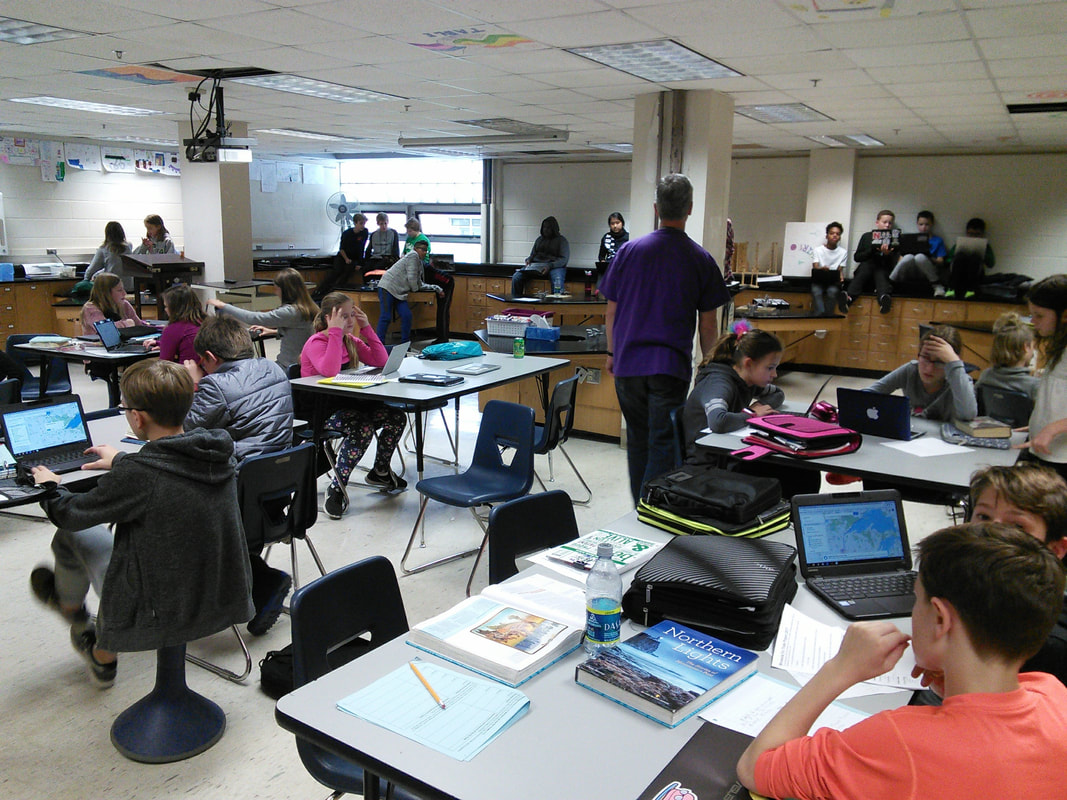 Personalized learning and student choice are spouting in our district. The pure concept is extremely exciting and scary compared to the practices we have delivered for many years. At the core, I really like looking at what is effective in our classrooms and adding student options to get there.
I’ve been building the student choice options. The early choice lessons of the school year were simply “Choice A” or “Choice B”, whatever the A or B was. 6th graders are still 11/12 years old, loving the chance to choose, but needing to be taught the process. This is all built around the question “What choice is best for your learning?”. This is very challenging since friends are often more important than academics. So here we are in mid-November rolling out a full blown student choice project. We are combining Science and Social Studies. Science has been working on motion via calculating speed and average speed. In Social Studies our state’s fur trade is the unit of study. I had loosely attempted to connect my Science with Minnesota History in the past. This project would be so much more. The speed concept would be the underlying standard, divided into two part. Driving from our school to the location of a historical fur trading post. Travel would be using current, modern means and requiring 3 stops on the way. Students would calculate moving speed and average speed with their stops. The return trip back to our school would be in 1804, the peak of the fur trade in our state. They had to research the limitations of traveling during that era, with no roads and travel progress which was limited to daylight hours. Being able to travel just 30-40 miles a day created a much more challenging math equation for a 300 plus mile journey on horseback. We used Google MyMaps as our tool to draw each route. I have used this tool in and out of class often. It is a bit of an acquired taste, but students found their way just fine. There are definitely many ways to display their route, with stops and all of the data points needed for calculations. Beyond traveling in the day of the fur trade, the social studies learning required pinning locations of key trading posts around Lake Superior. Students could clearly see the great effort traders endured moving from post to post. In addition, they learned the importance of those locations to sustain their exchange businesses to survive. Most students made this a completely different layer in MyMaps. Project participation options included working alone or with another student. In my experience, when student learning choice is given, groups of three are not as effective. From the beginning you could see and feel the learning energy. There were obvious waves of excitement flowing, as student found their virtual journey. Students clearly embraced having the option to take any route of their choice, as long as they could calculate their speed. Students hit the mark for both subjects, with excitement and a sense of accomplishment. Don’t get me wrong, there were presentations that are still emerging and needing some serious attention. Even when there were presentation accuracy errors, most student caught the mistake and could verbally fix on the spot. I appreciate that part of the project, which is more like real-life projects. We often don’t hit the mark the first time, but fix it and at learning generally sticks beyond the deadline. 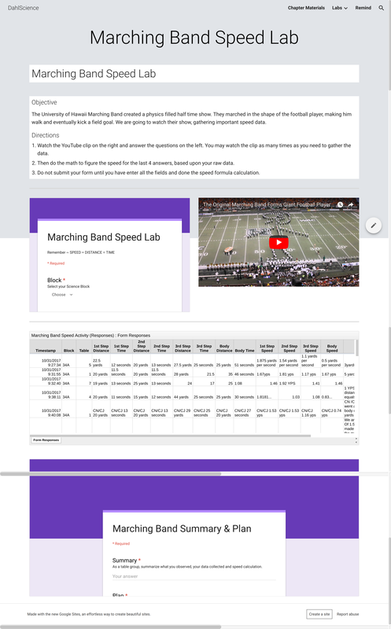 We are in the process of learning how to work together and to do collaborative labs in our 6th grade middle school experience. Our subject is physical science and we are in our motion chapter. The emphasis is calculating speed and average speed. There of course the basic “Distance over Time equals Speed” to calculate average speed.
Using the new Google sites, forms, spreadsheet and YouTube, we are able to achieve all of that in an interactive lab website. I used a YouTube video clip from the University of Hawaii marching band to calculate how fast the members were moving across the field for their halftime show. There are many videos of this type to use in an interactive website. I chose this one due to it ease of observing how the band members moved across the yard lines creating their half time entertainment. In the video I selected, the band created a stick figure football player, that would march down the field and finally kicking a football field goal, with the cheer team holding this large pigskin. Though the video is seven or eight years old, it is still a work of science beauty. The stick figure football player they created took two full steps and a third to kick the football. Our assignment was to calculate their average yards per second for each of the step as well as measuring the average speed for the center of the body. The initial class reaction to the video was amazement. Then it was time to get to work and start counting the yard lines that they that the band crossed. Next was to bring the element of time into each step to calculate the average speed. Students watched and re-watch the video to try to get it just right. When finished collected and calculating their data it time to enter in a user-friendly Google form. The form and video were laid out side-by-side on the lab website. A simple submit moved the lab table data to the spreadsheet, just below the video and the Google data entry form. Analyzing the lab data easy, whether in a large or small group. The students could compare their data with that of the other lab tables in this class, as well as all my other classes that did the same lab. If there was an error in data entry or calculation, the lab table could easily re-enter as needed and learning from those other data points that were entered. All of this happening in real-time in each class. In summary I felt this lab was a success. It promoted lab table collaboration, as well as table to table and even class to class. The new Google sites was so easy to create this lab, inserting the form, the results spreadsheet, and YouTube video. In addition, students not in class that day could do the lab from home or from a remote location as needed, still having the ability to collaborate digitally. |
Archives
January 2023
Categories |
 RSS Feed
